Measure your ISP's service quality
or just monitor your network quality
My home is only wired for access to two internet service providers, with the fastest download speed from one at 50 Mbps and the other at 500. Naturally, I use the faster option, but I rarely achieve the speeds I pay for, and that's while giving them the benefit of doubt -- I'm no network expert so I assume the fastest I've noticed my wireless devices achieve, ~350 Mbps, is the best possible under my combinations of router, phone, laptop, and network drivers. I frequently encounter network issues, from slow websites, video streaming, or other downloads to dropped calls, both personal and work-related. Recent occurrences had me searching for ways to monitor my network, to confidently explain my ISP's poor service quality.
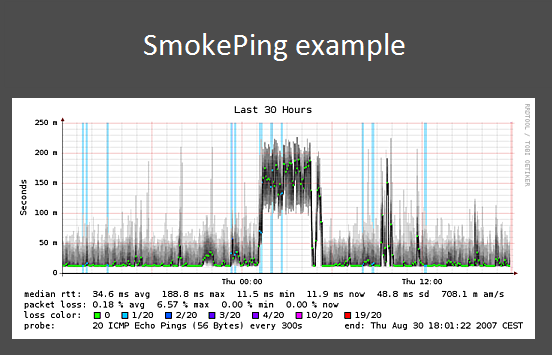
Having worked in IT, I've dabbled with the packet analysis tool, Wireshark, so my first thought was: can Wireshark also monitor network latency? A quick search showed that, while technically possible, this is not the tool for dedicated latency monitoring. The answers also led me to a tool for this purpose, SmokePing. Unfortunately, as a Windows user, SmokePing is only built for Linux, but I did find a healthier alternative, Vaping.
With a few tweaks to the original repository, available in the develop branch of my Vaping fork, and some irony, I achieved a Linux-based Docker deployment. The original project includes some outdated dependencies with known vulnerabilities, according to Docker Scout, hence my own modifications.
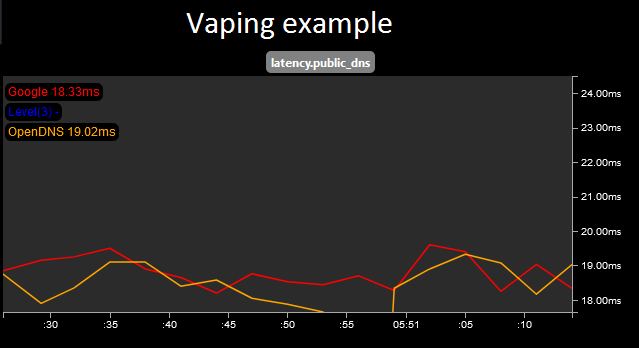
You may notice, both SmokePing and Vaping employ some ancient-looking graphing tools. They certainly function well, but I'm not one to pass up an opportunity for improvement. So I set off to make my own tool using dependencies and languages I'm more familiar with. Enter: NetMon with a .NET back-end, SQL persistence, and JavaScript UI.
Anatomy of a network monitor
At their core, SmokePing and Vaping use fping as their network "probe." Fping is an efficient utility for making ping, or ICMP, sweeps -- i.e., pinging multiple hosts at once. Perhaps in the future I'll update my NetMon tool for efficiency but for now .NET's Ping ability will do just fine.
private static async Task<(DateTime, long?)> Ping(int requestTimeout = 1000)
{
    var googleDnsIpAddress = "8.8.8.8";
    var ipAddress = IPAddress.Parse(googleDnsIpAddress);

    var byteSize = 32;
    var data = string.Join(string.Empty, Enumerable.Repeat('a', byteSize));
    var buffer = Encoding.ASCII.GetBytes(data);

    var allowedNumberOfHops = 64;
    var dontFragment = true;
    var options = new PingOptions(allowedNumberOfHops, dontFragment);

    var timestamp = DateTime.Now;
    var result = await new Ping().SendPingAsync(ipAddress, requestTimeout, buffer, options);

    var latency = result.Status is IPStatus.Success ? result.RoundtripTime : (long?)null;

    return (timestamp, latency);
}
To monitor the latency between your network and Google's DNS server (i.e., 8.8.8.8), this Ping method just needs to be called in a loop -- e.g., every 3 seconds over a 5 minute window.
public async Task Monitor()
{
    var resolution = 3000;
    var window = TimeSpan.FromMinutes(5);
    var windowMs = (int)window.TotalMilliseconds;

    var monitorStopwatch = Stopwatch.StartNew();

    do
    {
        var pingStopwatch = Stopwatch.StartNew();
        var (timestamp, latency) = await Ping();

        await SaveResult(timestamp, latency);
        pingStopwatch.Stop();

        var timeBeforeNextRequest = resolution - (int)pingStopwatch.ElapsedMilliseconds;
        Thread.Sleep(timeBeforeNextRequest);
    } while (monitorStopwatch.ElapsedMilliseconds < windowMs);

    monitorStopwatch.Stop();
}
For data storage, SmokePing and Vaping rely on fixed-size round robin databases (RDD) such as RRDtool or Graphite's whisper. These tools are specifically built to handle time series data, making them ideal for monitoring tasks. For my implementation, I chose the lightweight file-based SQL database, SQLite.
private async Task SaveResult(DateTime timestamp, long? latency)
{
    var connectionString = "Data Source=PATH_TO_FILE.db";

    await using var connection = new SqliteConnection(connectionString);
    connection.Open();

    var command = connection.CreateCommand();
    command.CommandText = @"
INSERT INTO PingResults (Timestamp, Latency)
VALUES ($timestamp, $latency)
";
    command.Parameters.AddWithValue("$timestamp", timestamp);
    command.Parameters.AddWithValue("$latency", latency is null ? DBNull.Value : latency.Value);

    _ = await command.ExecuteNonQueryAsync();
}
To display it's data, SmokePing leverages that aspect of RDDtool while Vaping uses it's author's graphsrv utility and/or graphite, depending on how it's been configured. My own tool uses a simple API built on ASP.NET and renders graphs with Plotly.js.
const getMonitorResults = async () => {
    const getUrl = "/NetworkLatency/GetResults"
    const response = await fetch(getUrl, { method: 'get' });

    return await response.json();
};

const renderPlot = (element, points) => {
    const xValues = points.map(({ timestamp }) => timestamp);
    const yValues = points.map(({ latency }) => latency);
    const trace = {
        x: xValues,
        y: yValues,
        type: 'scatter'
    };
    const largestYValue = [...yValues].sort((a, b) => a - b)[yValues.length - 1];
    const maxYValue = largestYValue > 100 ? largestYValue : 100;
    const layout = {
        title: { text: 'Network Latency'},
        xaxis: { title: { text: 'Time' } },
        yaxis: {
            title: { text: 'Latency (ms)' },
            range: [0, maxYValue]
        }
    };

    Plotly.newPlot(element, [trace], layout);
}
While the networking monitoring runs on the server, the UI is refreshed on the same cadence using simple JavaScript.
const getIsMonitorActive = async () => {
    const getUrl = "/NetworkLatency/IsMonitorActive"
    const response = await fetch(getUrl, { method: 'get' });
    const result = await response.text();

    return result.toLowerCase() === 'true';
};

const pollForResults = async () => {
    const isMonitorActive = await getIsMonitorActive();
    const results = await getMonitorResults();

    if (results.length > 0)
        plotMonitorResults(results);

    if (isMonitorActive)
        setTimeout(pollForResults, 3000);
    else
        console.log('Monitor not active');
};

document.addEventListener("DOMContentLoaded", function () {
    setTimeout(pollForResults, 100);
};
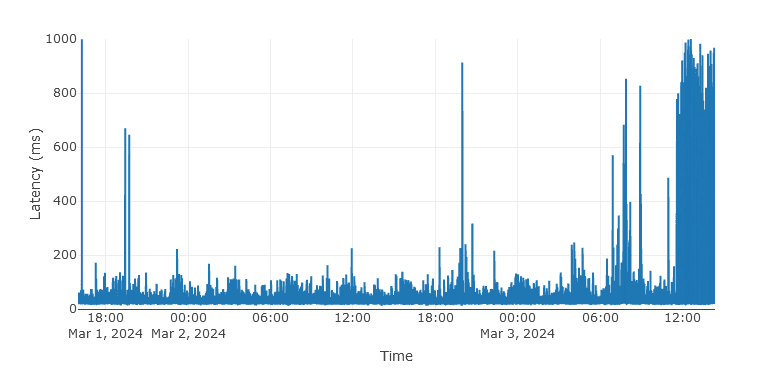
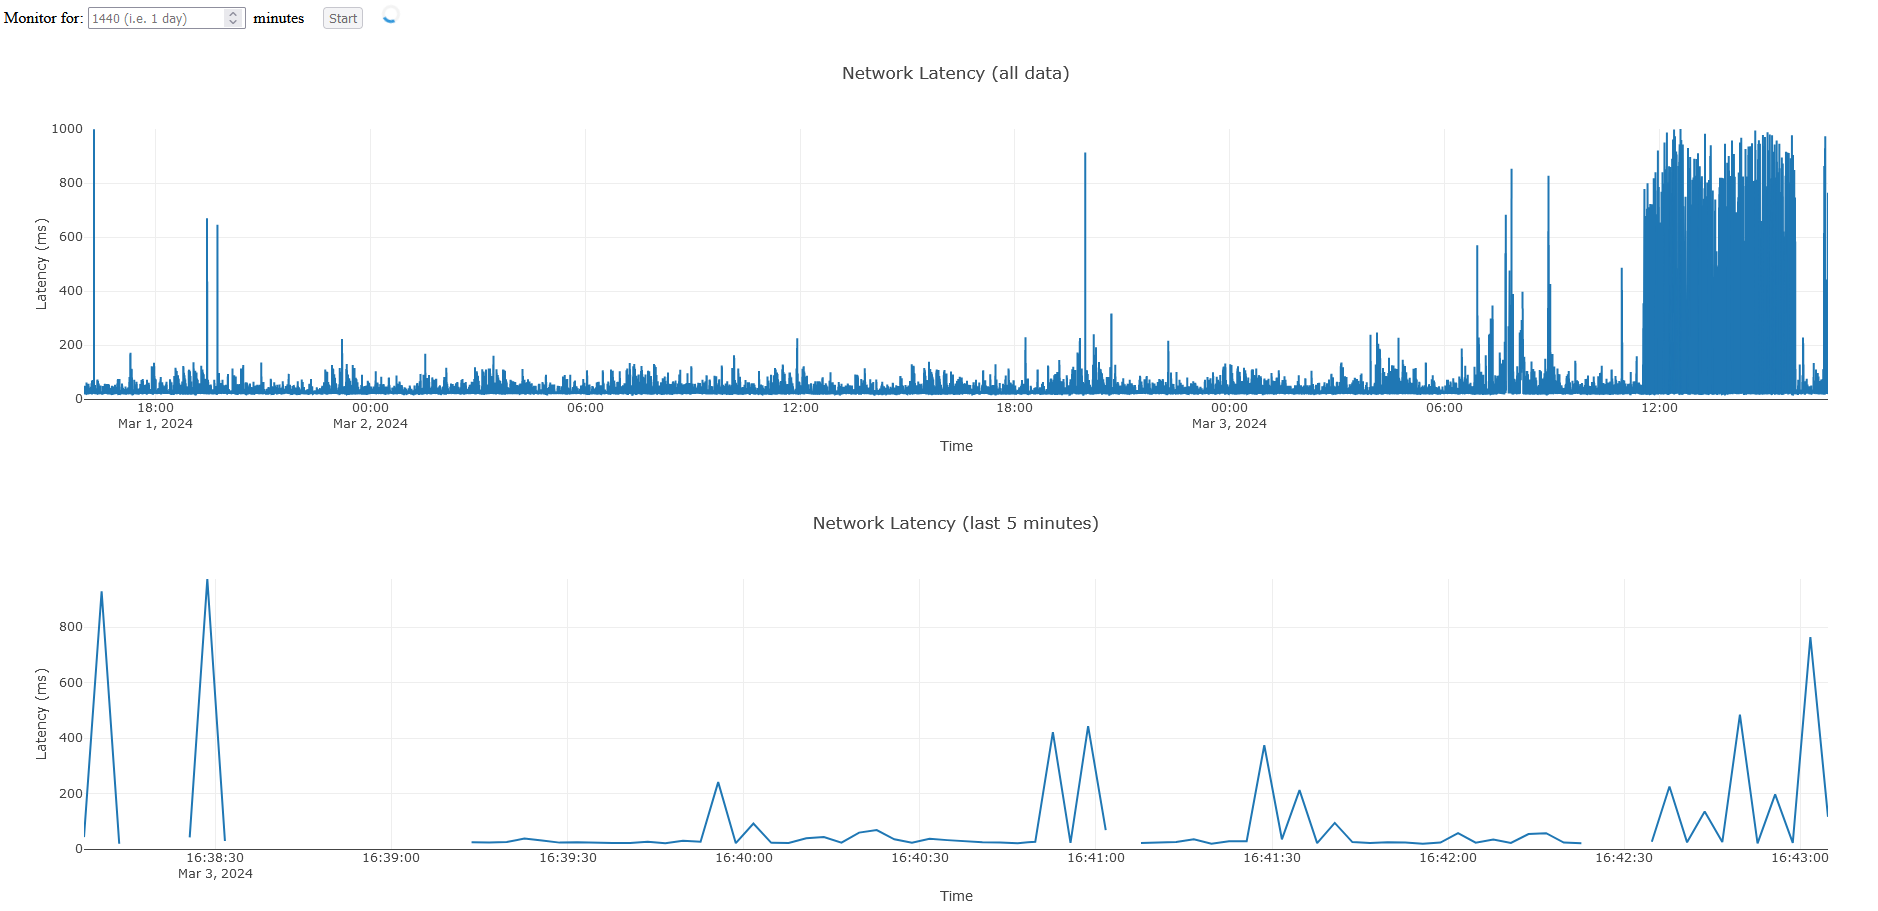
Altogether my NetMon tool looks like the following...
Home Setup
To truly monitor my home network and avoid leaving my laptop on with NetMon constantly running, I decided to utilize my old Raspberry Pi 3 Model B which comes equipped with WiFi.
To simplify this process, I containerized NetMon with Docker! The following Dockerfile will compile the ASP.NET application to run on the RasPi's 32-bit ARMv7 processor and build an image with the appropriate runtime.
FROM mcr.microsoft.com/dotnet/sdk:6.0 AS build-env
WORKDIR /app

# Copy, restore as distinct layers, and build/publish
COPY . ./
RUN dotnet restore
RUN dotnet publish -c Release -r linux-arm -o out

# Build runtime image
FROM mcr.microsoft.com/dotnet/aspnet:6.0.0-focal-arm32v7
ENV TZ="America/New_York"
WORKDIR /app
COPY --from=build-env /app/out .
ENTRYPOINT ["dotnet", "MTBjorn.NetMon.Web.dll"]

EXPOSE 7129
The image is built on my laptop and then loaded on the RasPi. The following PowerShell script uploads a compressed version of the Docker image to the RasPi over SSH using Putty tools, into the Downloads directory of my RasPi user. This assumes Docker has already been installed on the RasPi and SSH has been configured with private keys managed in Pageant, Putty's authentication agent -- of course, it could also be handled via password authentication.
# Build image
docker build -t netmon/v0.1 .

# Save image as a tarball
docker save -o "C:\image-netmon-v0.1.tar" netmon/v0.1

# Upload image over Putty's SSH file transfer
PSCP.EXE "C:\image-netmon-v0.1.tar" user@SERVER:Downloads/image-netmon-v0.1.tar
Once uploaded to the RasPi, a Docker container can be built and started.
# Load image into Docker
docker load -i Downloads/image-netmon-v0.1.tar

# Create container and map local port 7129 to container port 80
docker create --name netmon -p 7129:80 netmon/v0.1

# Start container
docker start netmon
With the container running on my RasPi, I'm able to access NetMon from any device in my home network at http://my-local-raspi:7129 😎
Conclusion
I plan to enhance NetMon with more functionality and an improved UI; check it out on GitHub: NetMon.