U.S. Senate Relative Political Positions (1789-present)
generating an animation
The below animation portrays how the divisiveness/cohesion within Congress & within the major parties has changed over time.
All credit for the data & associated plots goes to UCLA's Department of Political Science & their Voteview site, where the relative political position for each member of Congress is analyzed. See their about page for all the juicy details.
Ideological positions are calculated using the DW-NOMINATE (Dynamic Weighted NOMINAl Three-step Estimation). This procedure was developed by Poole and Rosenthal in the 1980s and is a "scaling procedure", representing legislators on a spatial map. In this sense, a spatial map is much like a road map--the closeness of two legislators on the map shows how similar their voting records are. Using this measure of distance, DW-NOMINATE is able to recover the "dimensions" that inform congressional voting behavior.
The primary dimension through most of American history has been "liberal" vs. "conservative" (also referred to as "left" vs. "right"). A second dimension picks up differences within the major political parties over slavery, currency, nativism, civil rights, and lifestyle issues during periods of American history.
On Voteview you can view 117 interactive plots, one for each Congress from 1789 to present. The horizontal axis represents how liberal or conservative each politician appears to be by analyzing their voting records in the context of economic legislation, relative to one another. The vertical axis represents how members relate within their own party on the above-quoted additional topics. Clicking through the years, you'll notice periods of division/union when the left to right spread expands/contracts & shifts in intraparty dynamics along the north-south line.
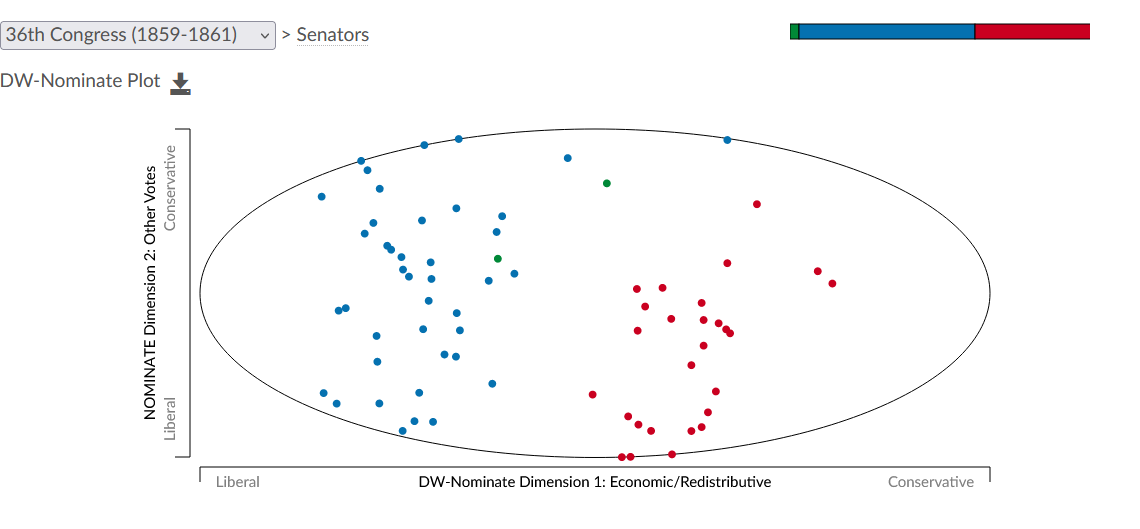
While the interactivity of Voteview is impressive, I felt it was lacking an animation that shows the shifting political climate. Why not download all the plots & create a gif? JavaScript & HTML inspection to the rescue!
The plots are scalable vector graphics (SVG), re-drawn when the dropdown (#congSelector) selection is changed. The SVG can be printed to a portable network graphics (PNG) file by clicking the save icon (.save_icon) below the dropdown. To permit quick & dirty automation, downloading a PNG should go straight to the downloads folder (i.e. disable the prompt for what to do upon download).
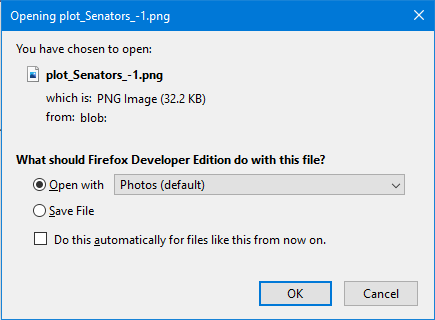
I prefer to choose the download option each time, so to reset (in Firefox): navigate to about:preferences, & under the General > Files & Applications options reset the action for PNG file types.
When it comes to automation of this sort, the beauty lies in how quickly you can build something that works "well enough;" best practices be damned (obligatory xkcd).
Plop the following script in the browser console and, in about 3 minutes, be rewarded with 117 freshly downloaded files. The wait may feel unbearable & I'm willing to bet the arbitrary delays I picked are wildly conservative. The script just (😬) needs large enough delays to ensure the graphic is redrawn after the dropdown's change event is triggered (delayBetweenSelectAndDownload), & the download has time to complete before the next selection (delayBetweenDownloads).
var dropdown = document.getElementById("congSelector");
var downloadButton = document.getElementsByClassName("save_icon")[0];
var changeEvent = new Event('change');
var optionCount = dropdown.children.length;
var delayBetweenSelectAndDownload = 500;
var delayBetweenDownloads = 1500;

var changeOption = (optionIndex) => {
    dropdown.selectedIndex = optionIndex;
    dropdown.dispatchEvent(changeEvent);
};

var downloadPlot = () => {
    downloadButton.click();
};

var downloadNextPlot = (optionIndex) => {
    if (optionIndex >= optionCount)
        return;

    changeOption(optionIndex);
    setTimeout(downloadPlot, delayBetweenSelectAndDownload);
    setTimeout(() => {
        downloadNextPlot(optionIndex + 1);
    }, delayBetweenDownloads);
};

var executePlotDownloadLoop = () => {
    downloadNextPlot(0);
};

executePlotDownloadLoop();
Since the image download relies on setTimeout, it's probably best to verify there are 117 unique images. For this, I whip out my trustee friend, PowerShell, with a quick hash check.
$hashes = Get-ChildItem . -Filter *.png |
    Get-FileHash |
    Select-Object -ExpandProperty Hash
if ($hashes.Count -ne 117) {
    throw "Invalid count!"
}

for ($i = 0; $i -lt $hashes.Count; $i++) {
    $currentHash = $hashes[$i]
    for ($j = $i + 1; $j -lt $hashes.Count; $j++) {
        if ($currentHash -eq $hashes[$j]) {
            throw "Files match!"
        }
    }
}
So long as the above succeeds, you can be sure there are exactly 117 unique PNG files. At this point (on Windows), it isn't particularly clear which image pertains to a given Congress, a problem easily solved with a little ingenuity...
Each file has the same name, appended with a number signifying the order in which it was downloaded (i.e. the default behavior for same-name downloads). Since the download loop starts at the present congress, the single file without an appended number can be renamed for the 117th Congress (e.g. 1_senate.png). The others can be determined by subtracting their download order from 117.
Get-ChildItem . -Filter plot_Senators* |
    Select-Object -ExpandProperty Name |
    ForEach-Object {
        $_ -match ".*\((\d*)\)" |Out-Null;
        $number = 117 - $Matches[1];
        $fileName = "$($number)_senate.png";
        Rename-Item $_ $fileName;
    }
NOTE: renaming the files is only for organization.
Now, the file names may contain a reference to their associated Congress but the images themselves do not. Using ImageMagick convert, additional text can be added to the plots, like a title, reference years, & citation.
# Get images in correct order
$imagesInOrder = Get-ChildItem . -Filter *.png |
    Select-Object -ExpandProperty Name |
    ForEach-Object {
        $_ -match "(\d*)" |Out-Null;
        $number = [System.Int32]::Parse($Matches[1]);
        $_ |Add-Member -Type NoteProperty -Name Number -Value $number -PassThru
    } |Sort-Object -Property Number

# Add additional information to each image
$font = "C:\Windows\Fonts\LatoWeb-Regular.ttf"
$title = "RELATIVE POLITICAL POSITIONS"
$citation = "plots from: voteview.com/congress/senate"
$currentSenateStartYear = 1789
foreach ($image in $imagesInOrder) {
    $label = "SENATE $($currentSenateStartYear)-$($currentSenateStartYear + 2)"
    $imageFileName = $image.Substring(0, $image.IndexOf('.'))
    $newFileName = "$($imageFileName)_labeled.png"
    $image |Add-Member -Type NoteProperty -Name NewFileName -Value $newFileName

    & magick.exe convert $image -font $font -fill "#555555" -pointsize 15 -draw "text 90,40 '$label'" $newFileName
    & magick.exe convert $newFileName -font $font -fill black -pointsize 20 -gravity North -draw "text 30,0 '$title'" $newFileName
    & magick.exe convert $newFileName -font $font -fill "#555555" -pointsize 12 -gravity SouthEast -draw "text 30,10 '$citation'" $newFileName

    $currentSenateStartYear += 2
}
The font (lato), label font size (15), & label color (#555555) come from the CSS used on Voteview. So as not to irreparably alter the originally downloaded plots, those with enhancements were renamed.
Using the same sorted images object, the following will generate a gif with each frame lasting half a second (i.e. 2 FPS).
$secondsPerFrame = 0.5
$delayValue = 100 * $secondsPerFrame
$labeledImages = $imagesInOrder |select -ExpandProperty NewFileName
& magick.exe convert -delay $delayValue -loop 0 $labeledImages VoteView_Senate.gif
And there you have it, a freshly minted animation.